Resource Monitoring
To effectively monitor CPU, memory, interface in Versa Networks VOS appliance, administrators should adopt a multi-layered approach combining historical/real-time diagnostics, threshold management, and infrastructure optimizations. Here are the key best practices:
CPU & Memory Utilization
Diagnostics:
1. Check the analytics dashboard for historical usage of CPU/Memory/Service load
Under Analytics> Dashboard> System> , we can see summary usage per device as follows:
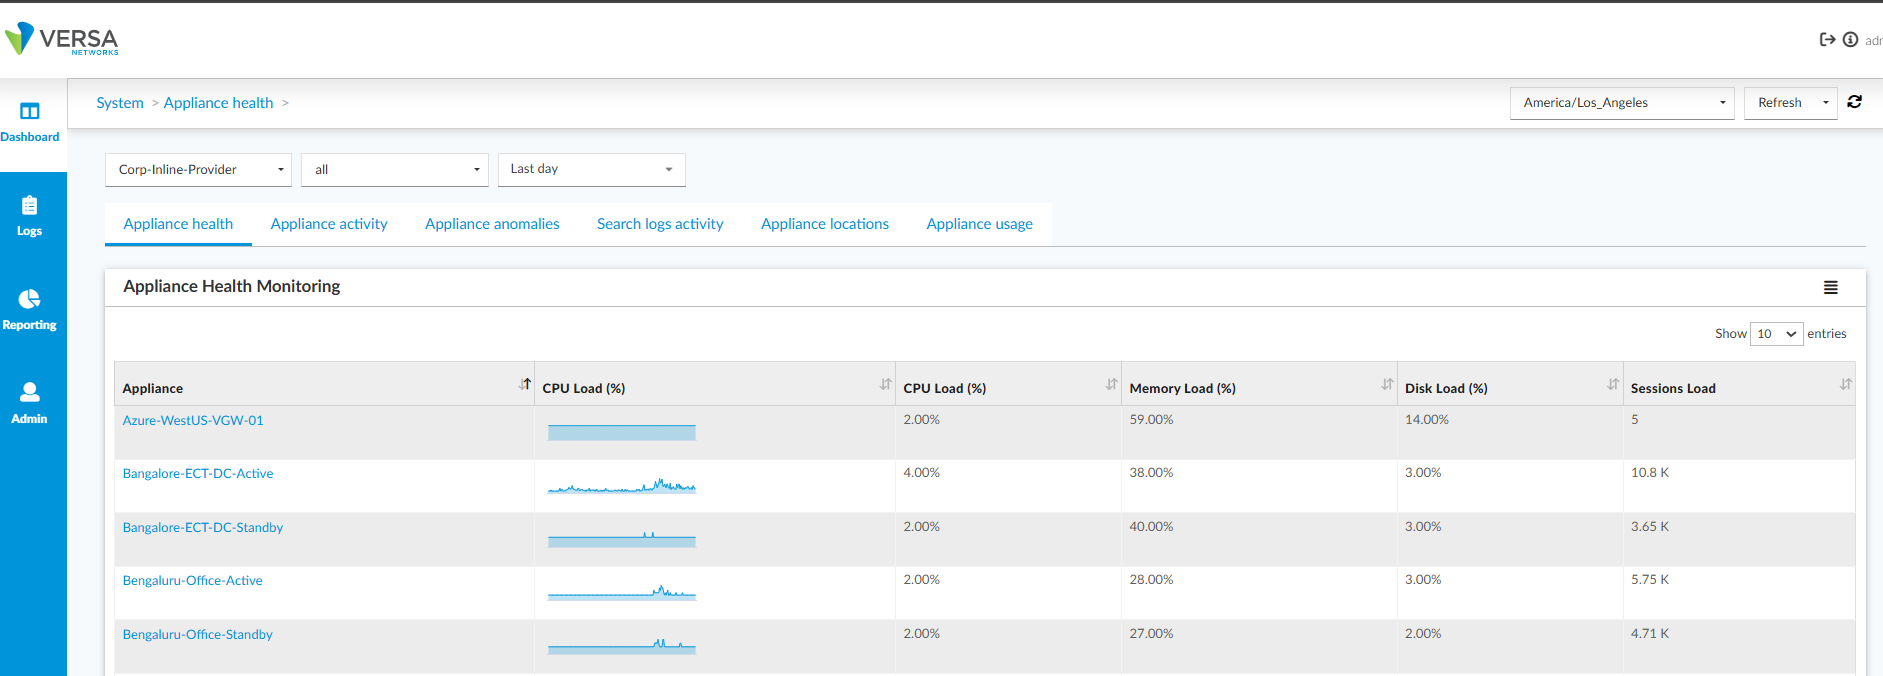
For a multi-tenant branch, this system usage is available in appliance owner tenant’s context.
On drilldown of an appliance, historical view can be seen
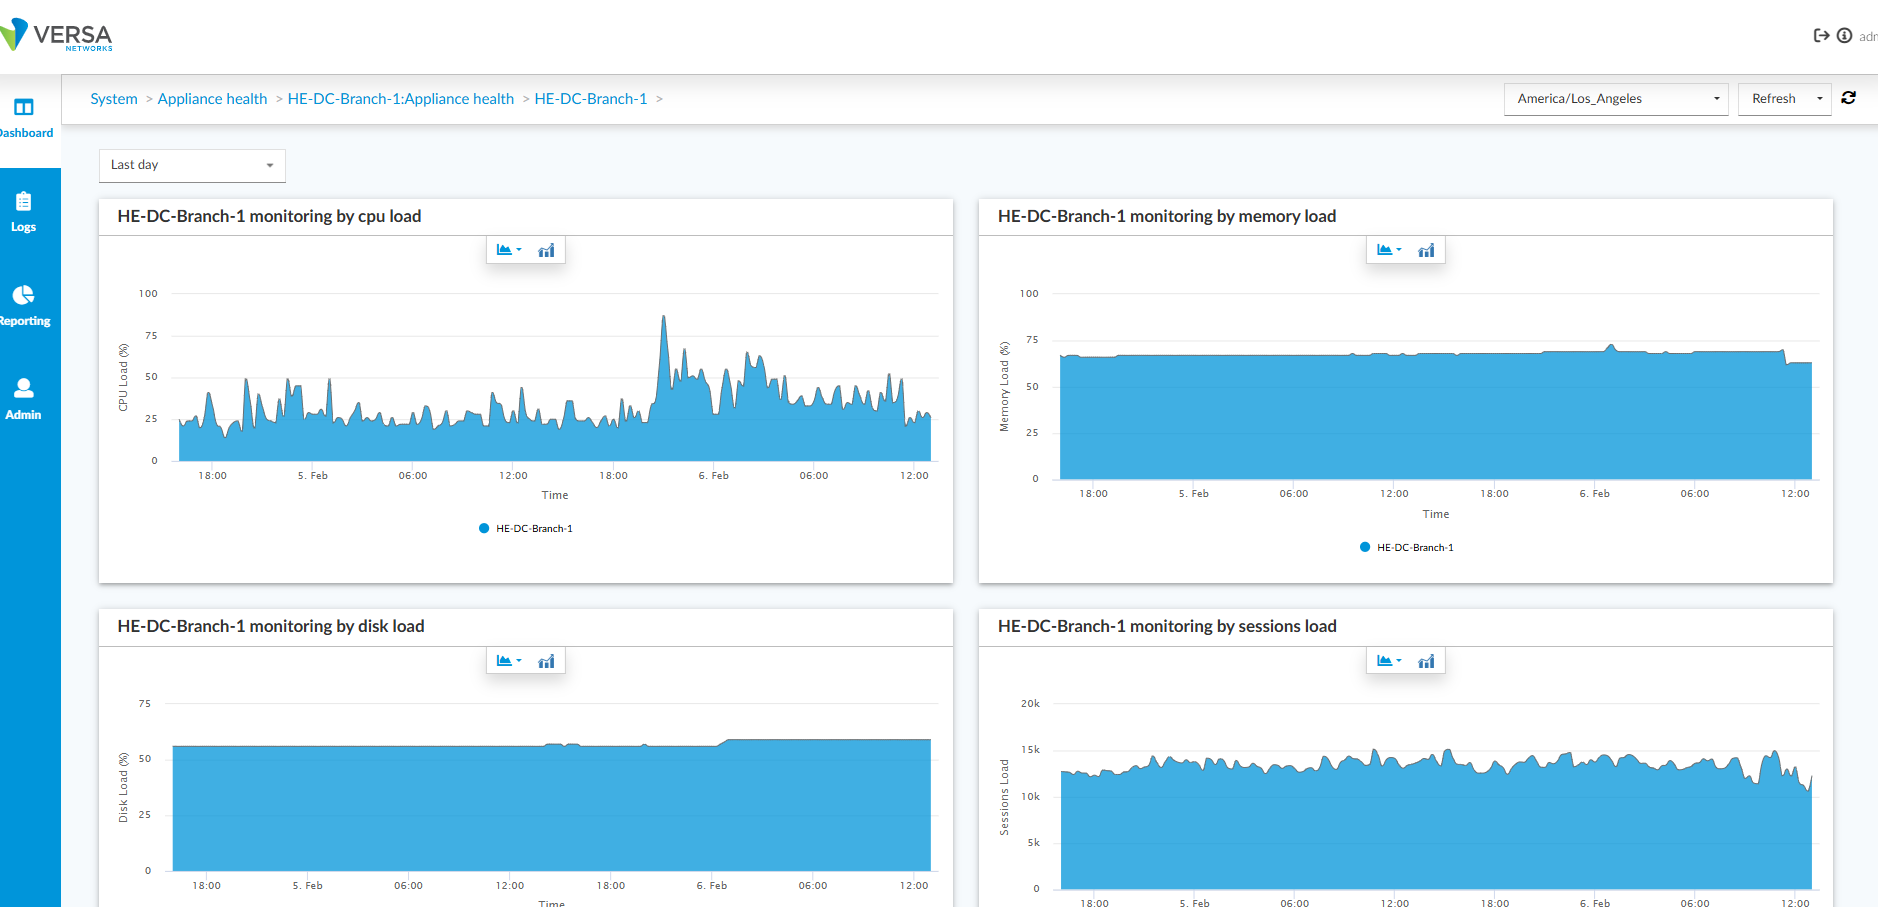
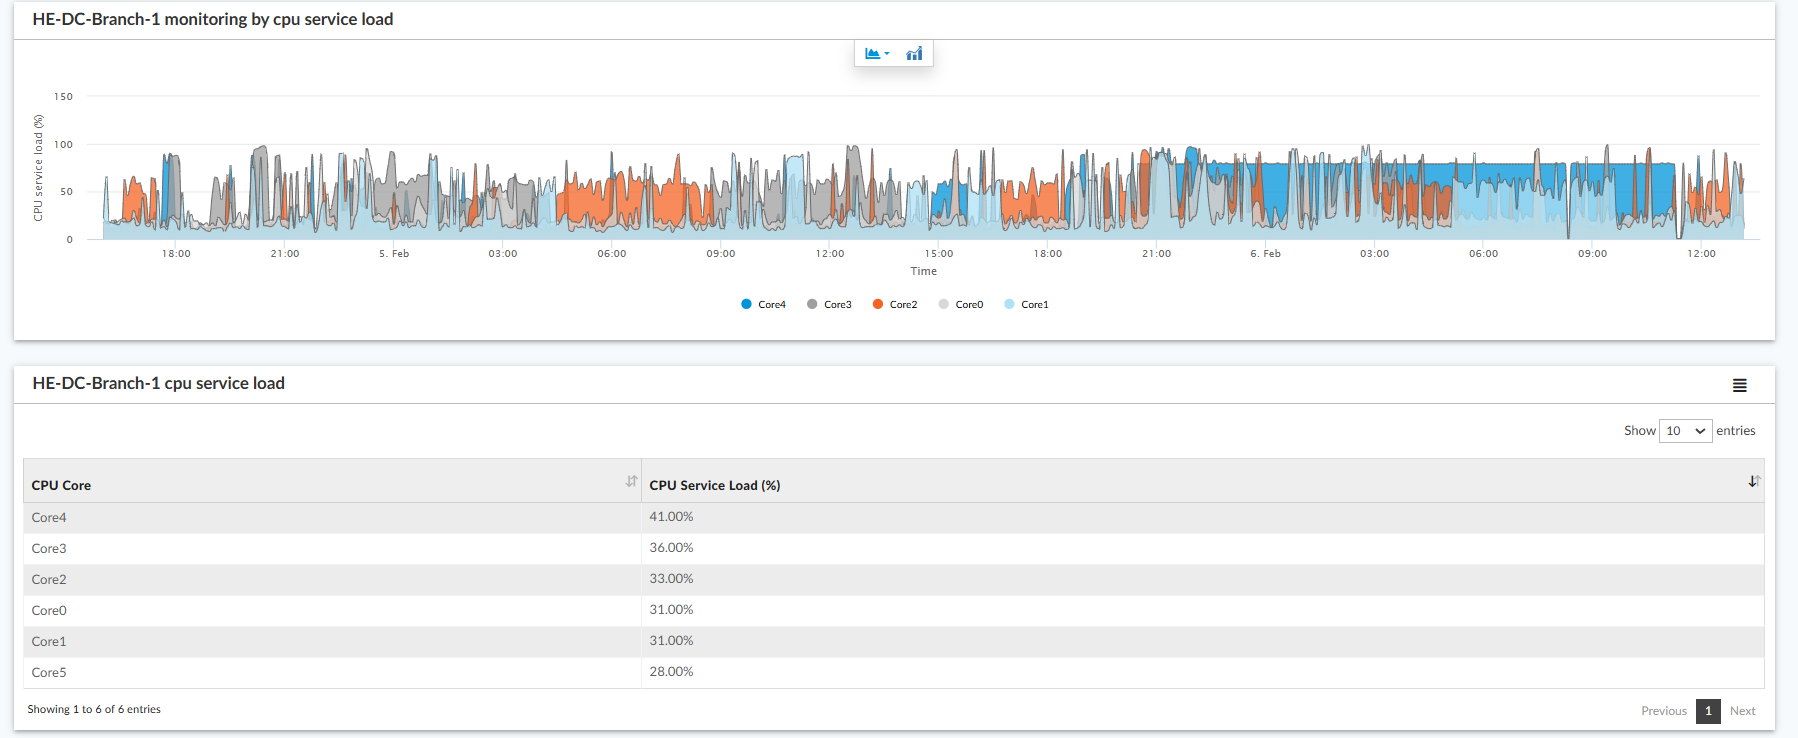
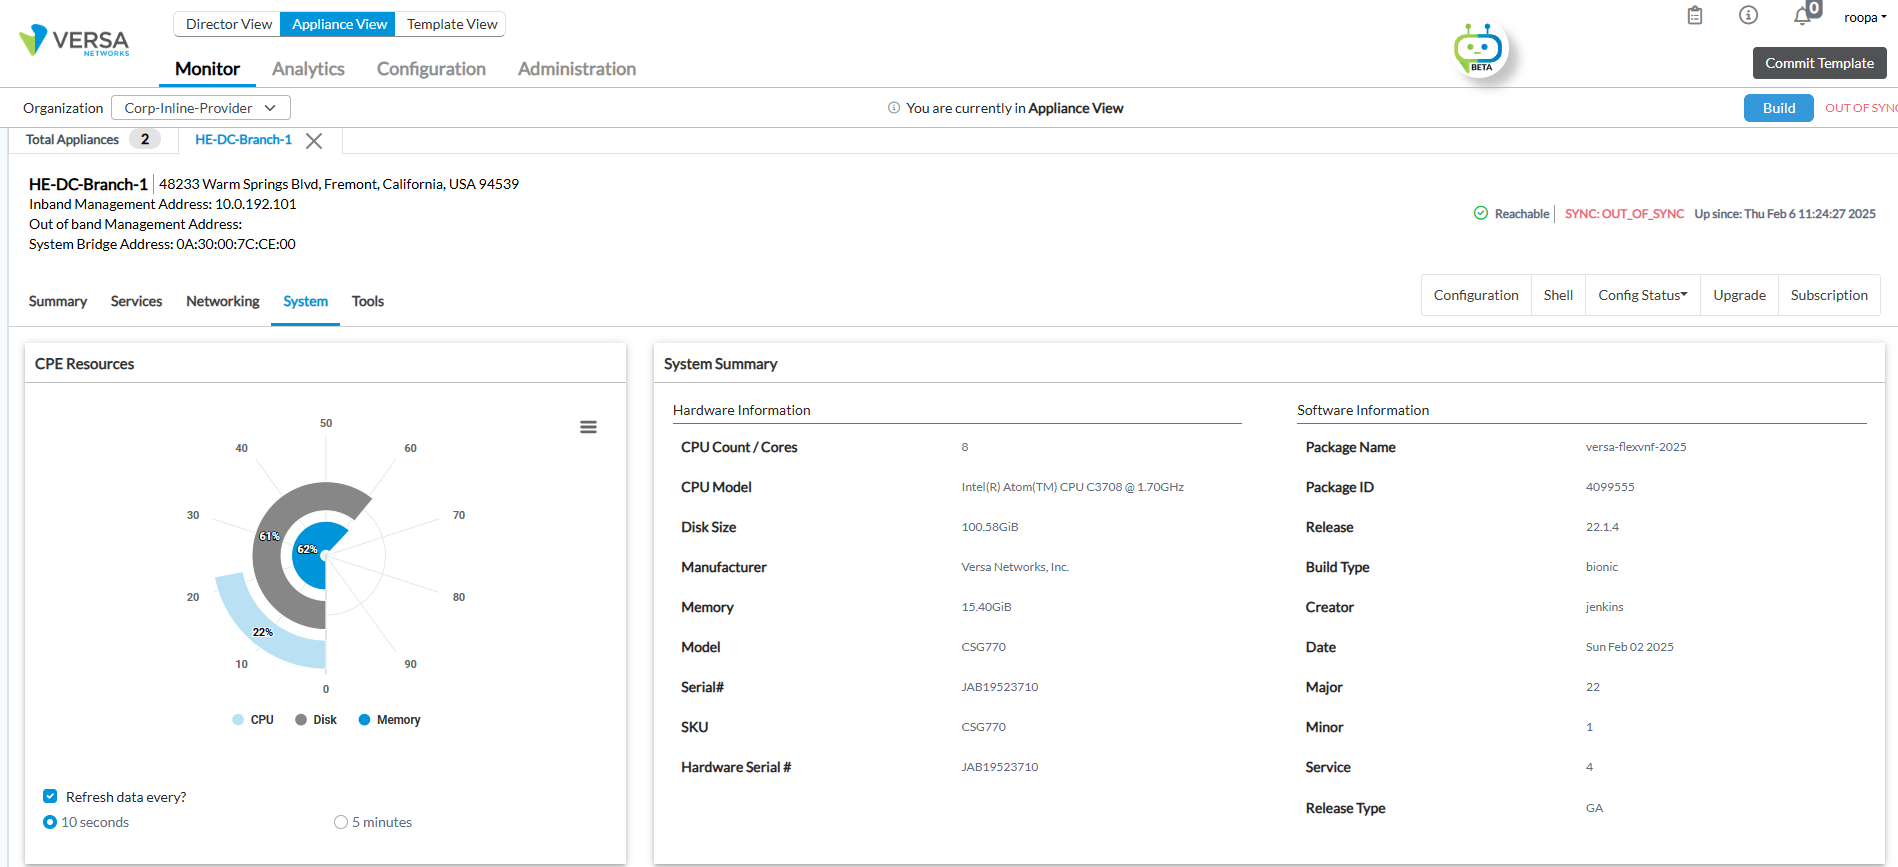
2. For real time view of the CPU / Memory utilization, Versa Director Monitor dashboard can be accessed for the appliance as follows:
3. Monitor CPU and memory using SNMP
We recommend to use Versa analytics and Versa director for monitoring CPU and Memory. If you have preference to monitor CPU and Memory using SNMP, you can walk on below tables to get CPU and memory usage. Please download Versa MIBs from releases directory.
Aggregated CPU usage:
using MIB name:
versa@SDWAN-Client:~$ sudo snmpwalk -v2c -c public -M /var/tmp/versa-mibs 10.40.46.108:161 DEVICE-MIB::deviceCPULoad
DEVICE-MIB::deviceCPULoad.16 = Gauge32: 30
VSMD output from where it is being fetched:
$ vsh connect vsmd -c "show vsm load now" | grep WT-Avg
Connection closed by foreign host.
WT-Avg ------ 2 --- 31
Equivalent CLI command:
show device clients
Using MIB OID:
versa@SDWAN-Client:~$ sudo snmpwalk -v2c -c public -M /var/tmp/versa-mibs 10.40.46.108:161 .1.3.6.1.4.1.42359.2.2.1.1.1.1.2.16
DEVICE-MIB::deviceCPULoad.16 = Gauge32: 28
Per core CPU usage:
Using MIB name:
versa@SDWAN-Client:~$ sudo snmpwalk -v2c -c public -M /var/tmp/versa-mibs 10.40.46.108:161 DEVICE-MIB::deviceCpuLoadPercentage
DEVICE-MIB::deviceCpuLoadPercentage."CPU0" = STRING: 17.0
DEVICE-MIB::deviceCpuLoadPercentage."CPU1" = STRING: 29.29
DEVICE-MIB::deviceCpuLoadPercentage."CPU2" = STRING: 28.28
DEVICE-MIB::deviceCpuLoadPercentage."CPU3" = STRING: 50.0
DEVICE-MIB::deviceCpuLoadPercentage."CPU4" = STRING: 42.0
DEVICE-MIB::deviceCpuLoadPercentage."CPU5" = STRING: 64.64
DEVICE-MIB::deviceCpuLoadPercentage."CPU6" = STRING: 19.19
DEVICE-MIB::deviceCpuLoadPercentage."CPU7" = STRING: 23.46
Equivalent CLI command:
show device cpuload
Using MIB OID:
versa@SDWAN-Client:~$ sudo snmpwalk -v2c -c public -M /var/tmp/versa-mibs 10.40.46.108:161 .1.3.6.1.4.1.42359.2.2.1.1.5.1.2
DEVICE-MIB::deviceCpuLoadPercentage."CPU0" = STRING: 14.0
DEVICE-MIB::deviceCpuLoadPercentage."CPU1" = STRING: 21.0
DEVICE-MIB::deviceCpuLoadPercentage."CPU2" = STRING: 15.0
DEVICE-MIB::deviceCpuLoadPercentage."CPU3" = STRING: 74.0
DEVICE-MIB::deviceCpuLoadPercentage."CPU4" = STRING: 43.56
DEVICE-MIB::deviceCpuLoadPercentage."CPU5" = STRING: 26.0
DEVICE-MIB::deviceCpuLoadPercentage."CPU6" = STRING: 28.0
DEVICE-MIB::deviceCpuLoadPercentage."CPU7" = STRING: 17.82
versa@SDWAN-Client:~$
Memory usage:
Using MIB name:
versa@SDWAN-Client:~$ sudo snmpwalk -v2c -c public -M /var/tmp/versa-mibs 10.43.71.6:161 DEVICE-MIB::deviceMemoryLoad
DEVICE-MIB::deviceMemoryLoad.16 = Gauge32: 43
versa@SDWAN-Client:~$
Using MIB OID:
versa@SDWAN-Client:~$ sudo snmpwalk -v2c -c public -M /var/tmp/versa-mibs 10.43.71.6:161 .1.3.6.1.4.1.42359.2.2.1.1.1.1.3.16
DEVICE-MIB::deviceMemoryLoad.16 = Gauge32: 43
versa@SDWAN-Client:~$
4. For troubleshooting in real time using appliance VOS CLI:
Go to the shell of the appliance from Versa Director Monitor view.
- For basic CPU and memory utilization metrics.
admin@SDWAN-Branch-cli> show system-load stats
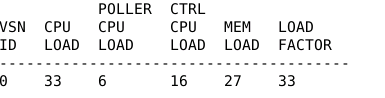
- For granular per-process CPU consumption
admin@SDWAN-Branch-cli> show processes cpu
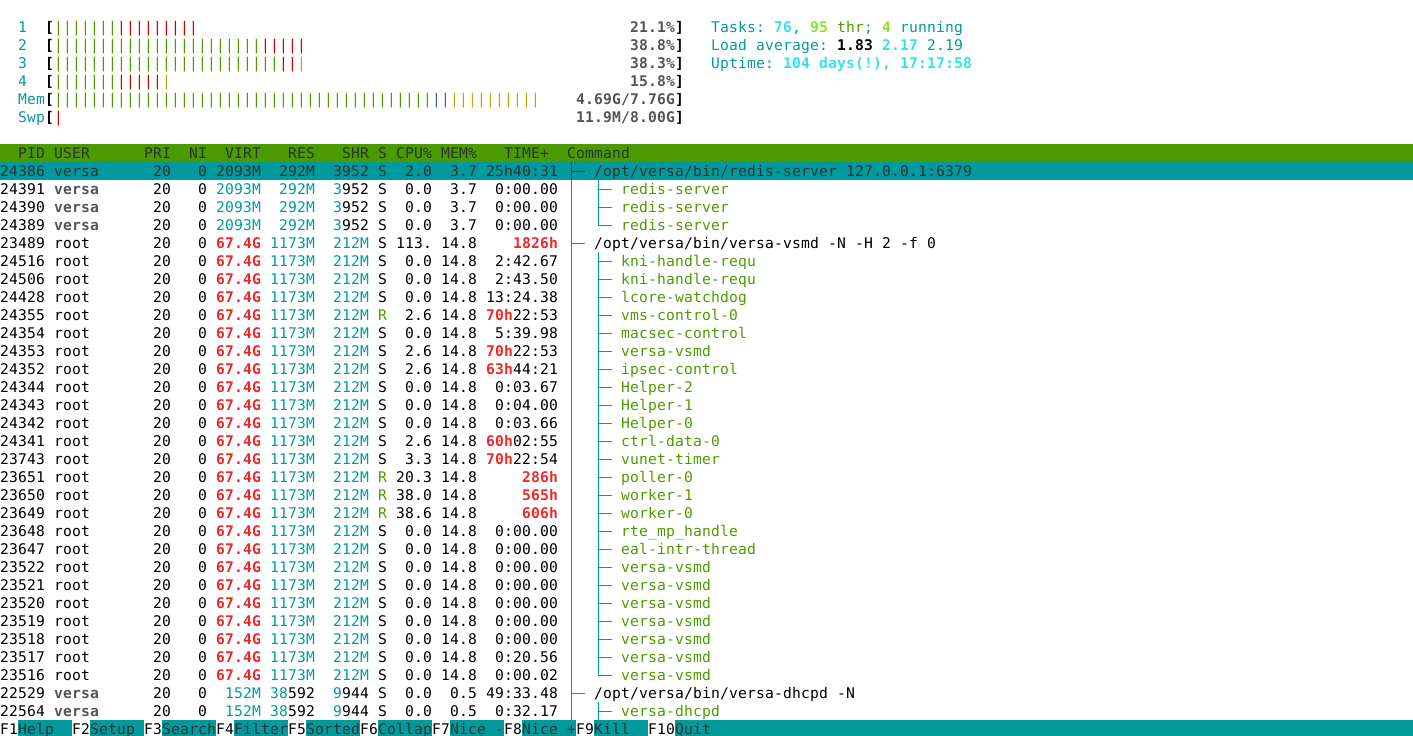
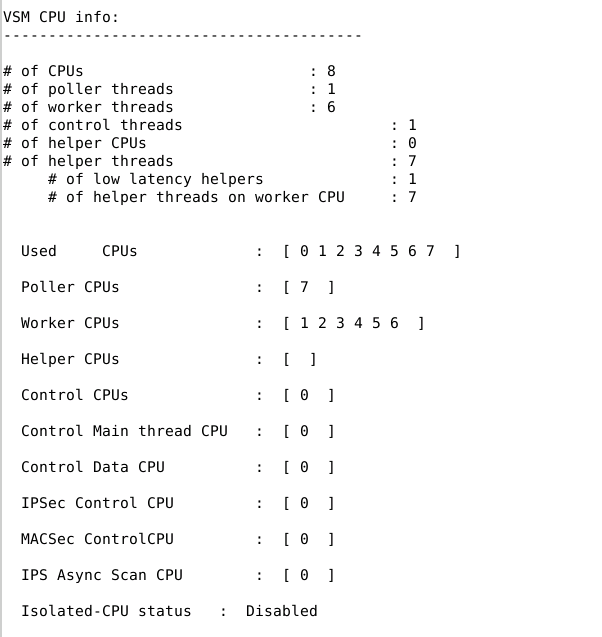
- For hardware specs and core allocation
admin@SDWAN-Branch-cli> show system details
- SSH to the appliance shell to run additional commands
- top -H displays thread-level CPU usage (press 1 to see per-core stats)
- lscpu | grep Thread confirms hyperthreading status
- On vsm debug cli (also called VTY) to check worker/poller thread distribution as follows:
[admin@SDWAN-Branch]$ vsh connect vsmd
vsm-vcsn0> show vsm cpu info
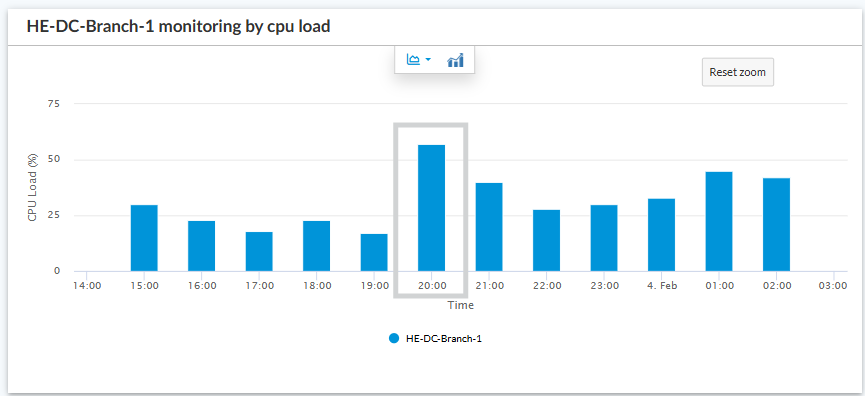
5. To identify traffic bursts causing CPU spikes
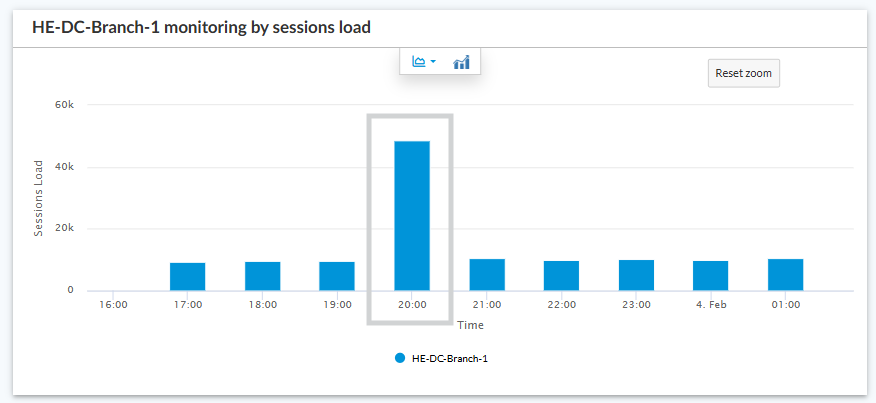
Historical active sessions load chart can be checked to see if high CPU utilization is due to sudden spike in session load under Dashboard> System> view for the appliance.
Below chart shows an example of CPU utilization spike during session bursts
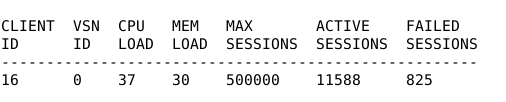
Real time stats for number of active sessions on an appliance can be seen using following command on appliance CLI.
admin@SDWAN-Branch-cli> show device clients
Threshold Management
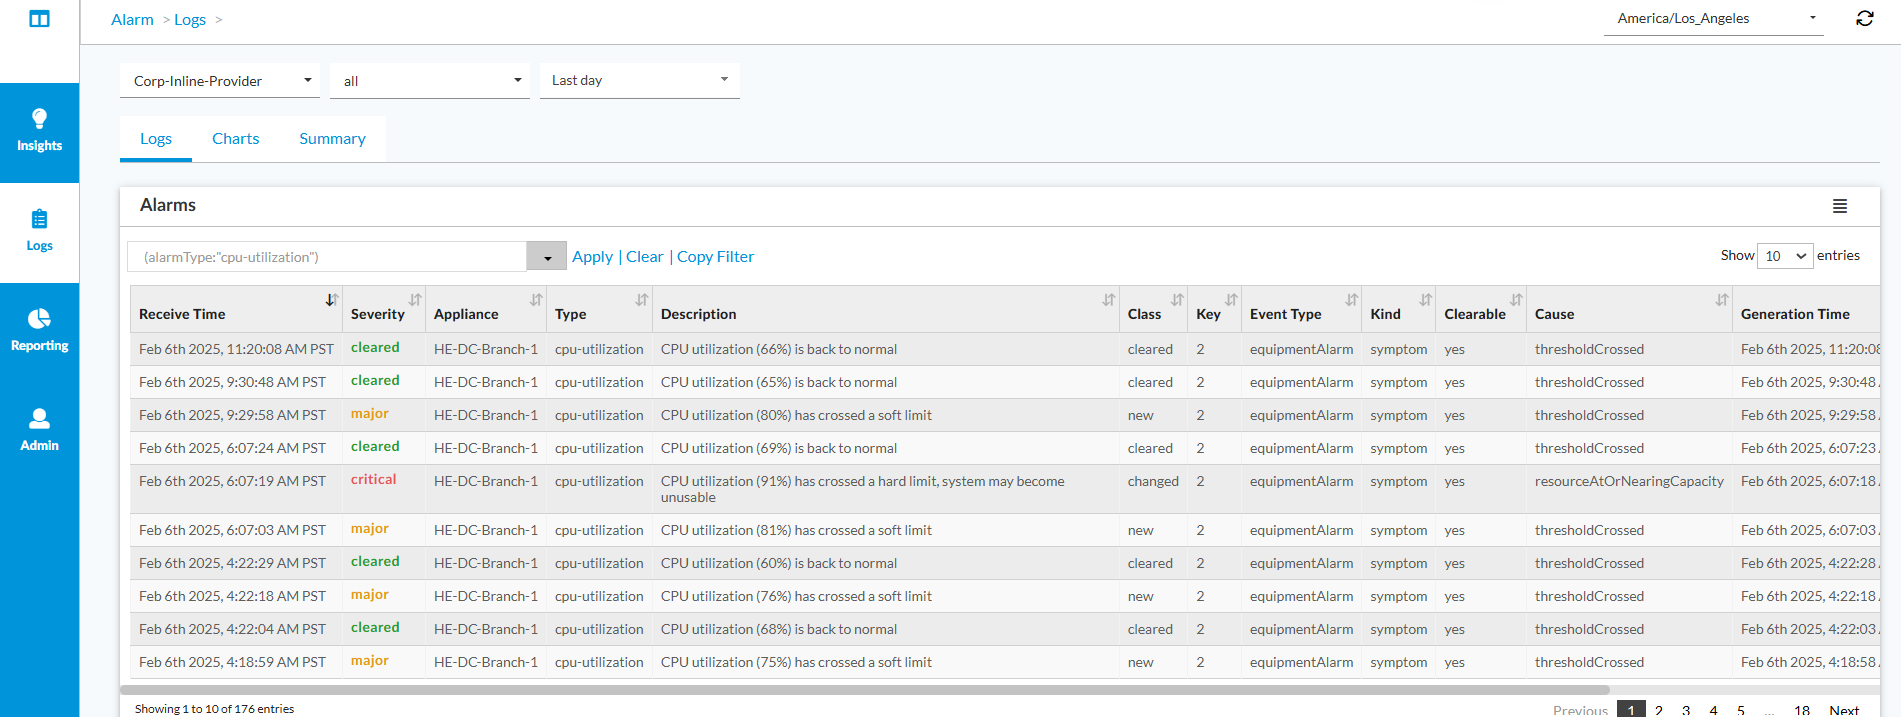
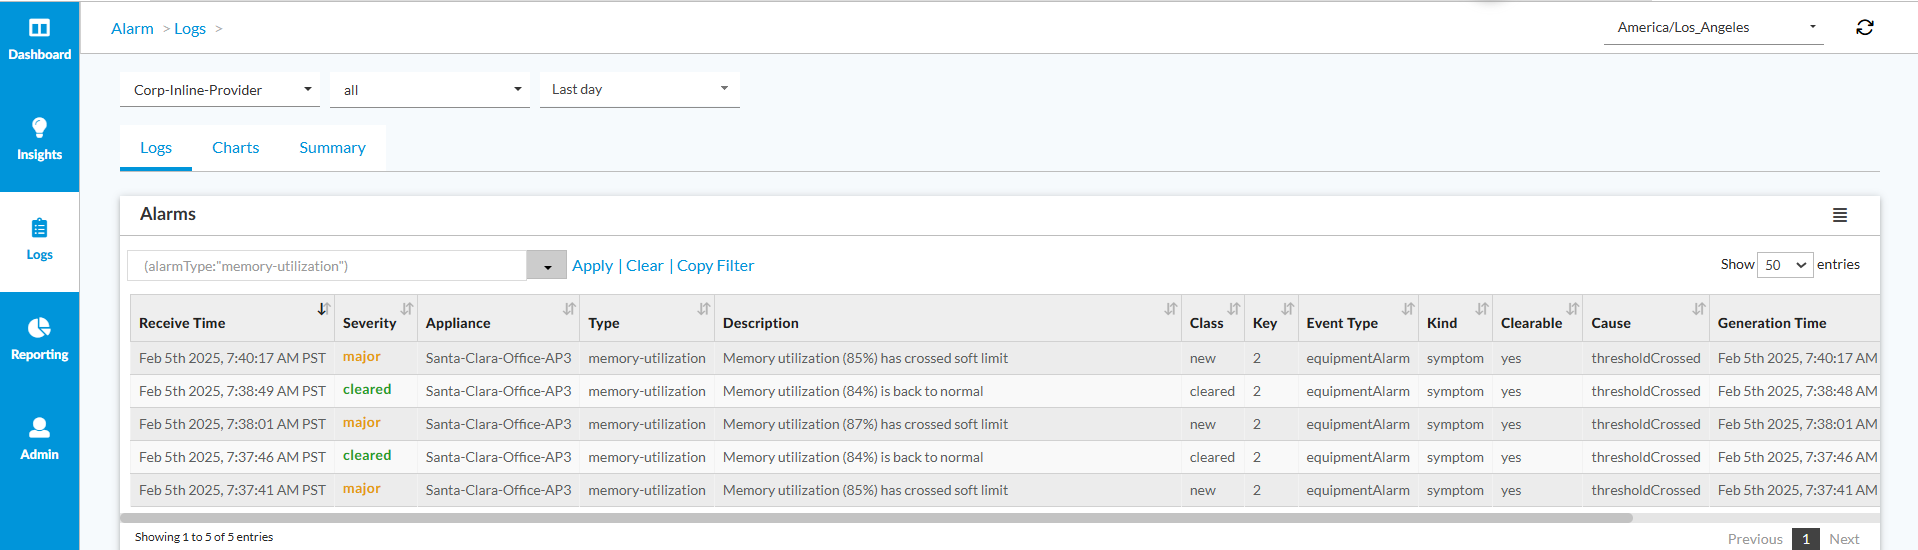
Alarms are generated when CPU/memory or service load exceeds thresholds.
- Default CPU alarms:
- High utilization: Triggered at 75%
- Critical utilization: Activated at 95%
- Memory thresholds:
- Warning at 70% usage
- Critical alert at 90%
Users could modify the default thresholds from the director per appliance.
All CPU/Memory/Service load alarms can be seen historically in analytics under Logs> Alarm view as follows:
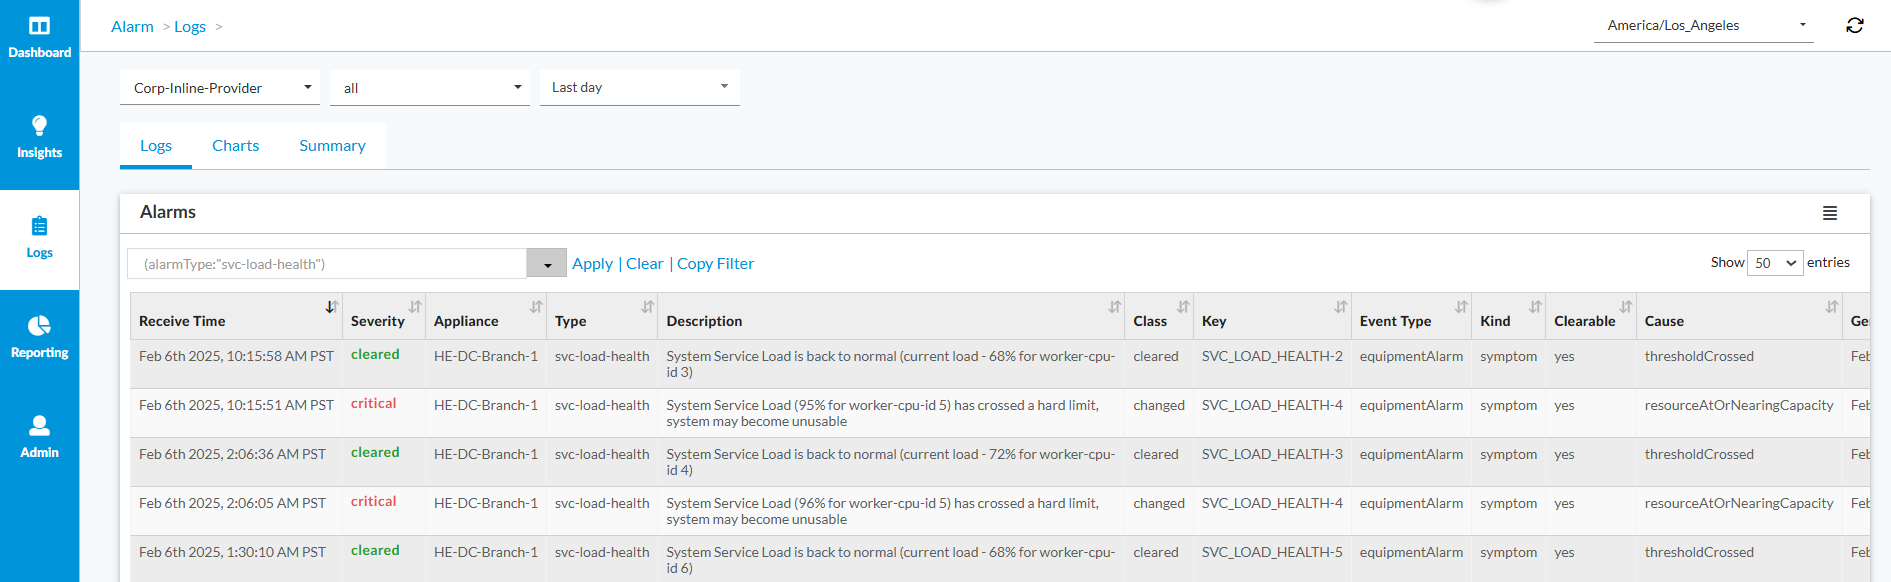
Versa director monitor also shows the active pending CPU/Memory/Service load alarms.
Additionally, Under Analytics> Dashboard> System> Appliance anomalies tab, we can see anomaly stats per device as follows:
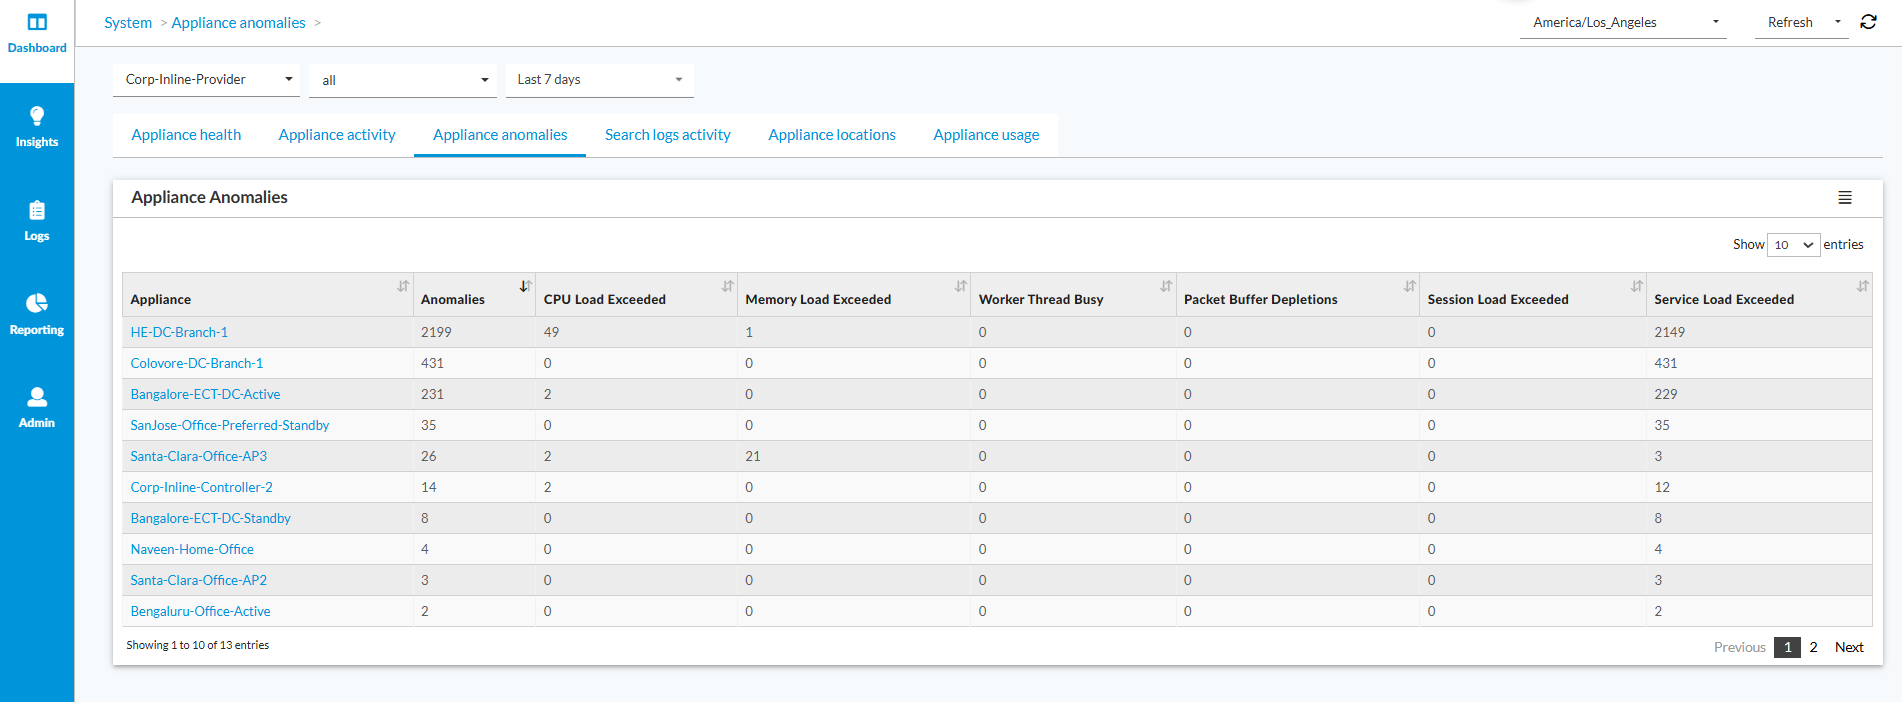
Drill down on an appliance will give the time series data per anomaly. This helps detect if certain unexpected events were seen historically which could cause stability issues with the appliance.
Optimizations
Virtualization Best Practices
- Resource allocation:
- Dedicate CPU cores/memory with 1:1 provisioning
- Disable hyperthreading in host BIOS
- Use CPU pinning for deterministic performance
- Optimization commands:
admin@SDWAN-Branch-cli> request system isolate-cpu enable num-control-cpu 2
Isolates control plane CPUs in controller-heavy deployments
Interface Utilization
Diagnostics:
1. Check the analytics dashboard for historical usage of interface utilization
Under Analytics> Dashboard> System>Interfaces, we can see historical usage per appliance, per WAN link as follows:
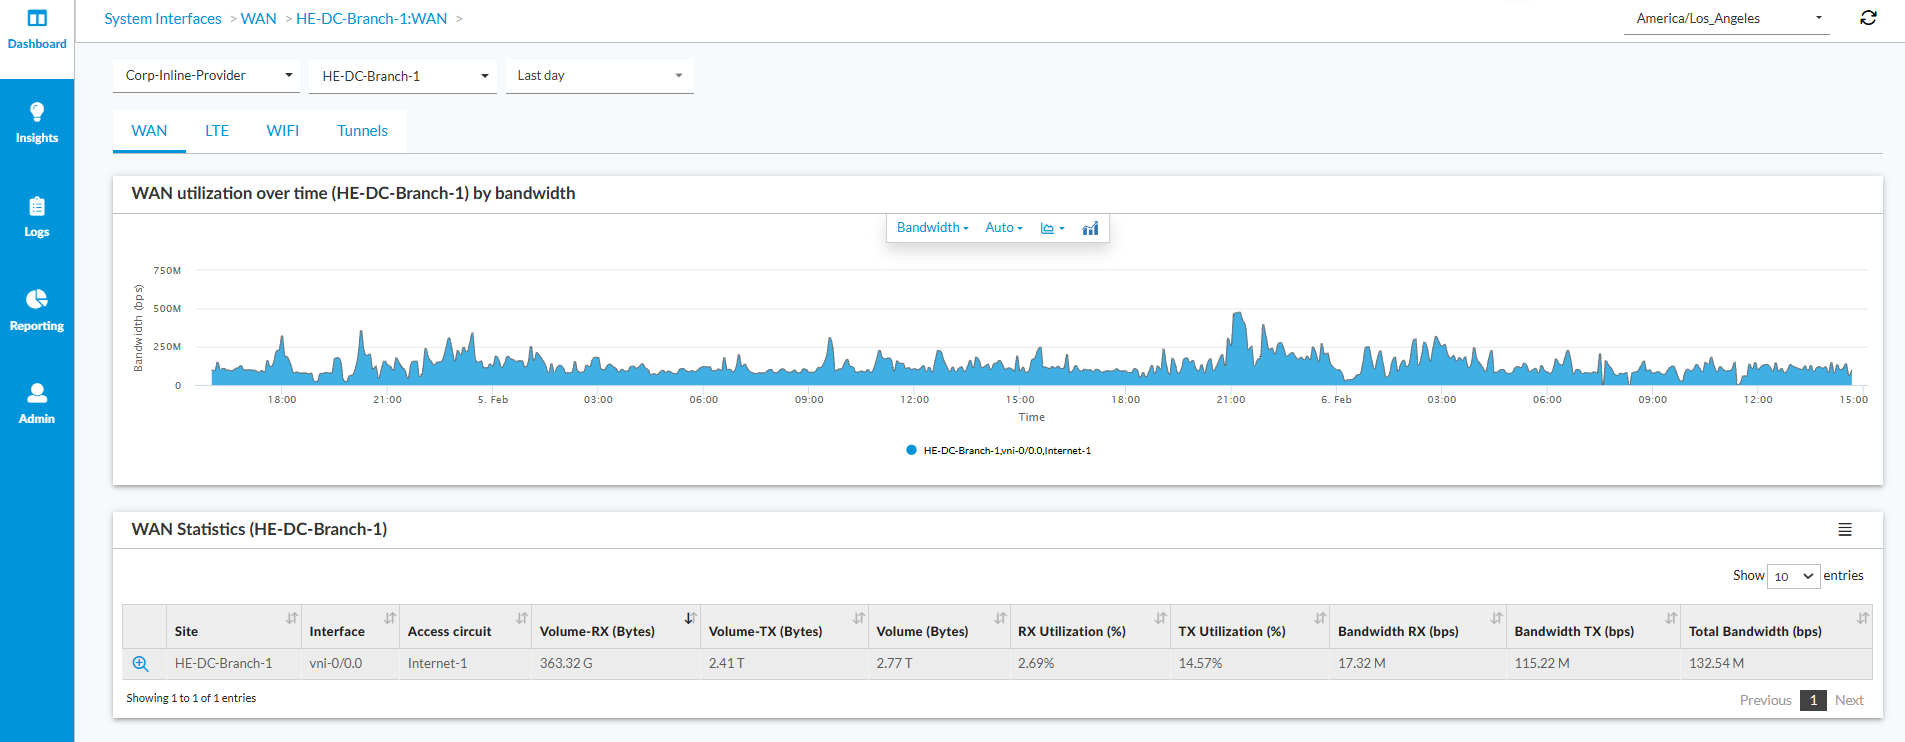
Rx and Tx utilization metrics show percentage utilization of uplink and downlink bandwidth configured on the interface. Uplink/downlink bandwidth needs to be configured per appliance/per WAN link from Versa director for the utilization calculation reliably.
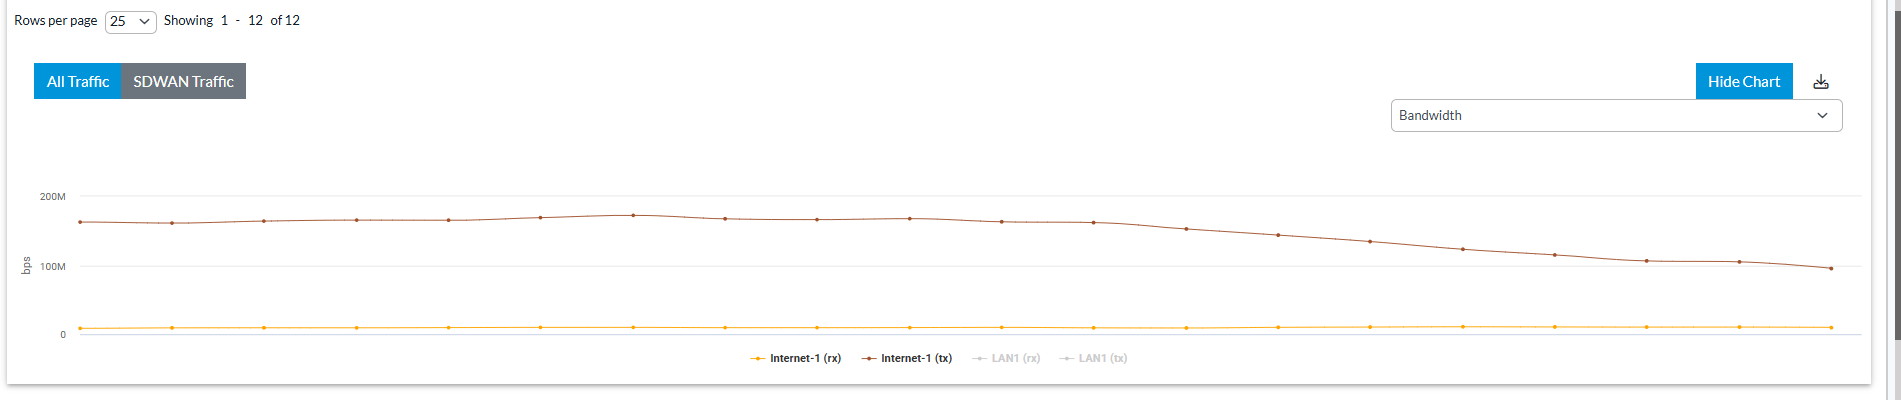
2. For real time view of interface utilization, Versa Director Monitor dashboard can be accessed for the appliance as follows:
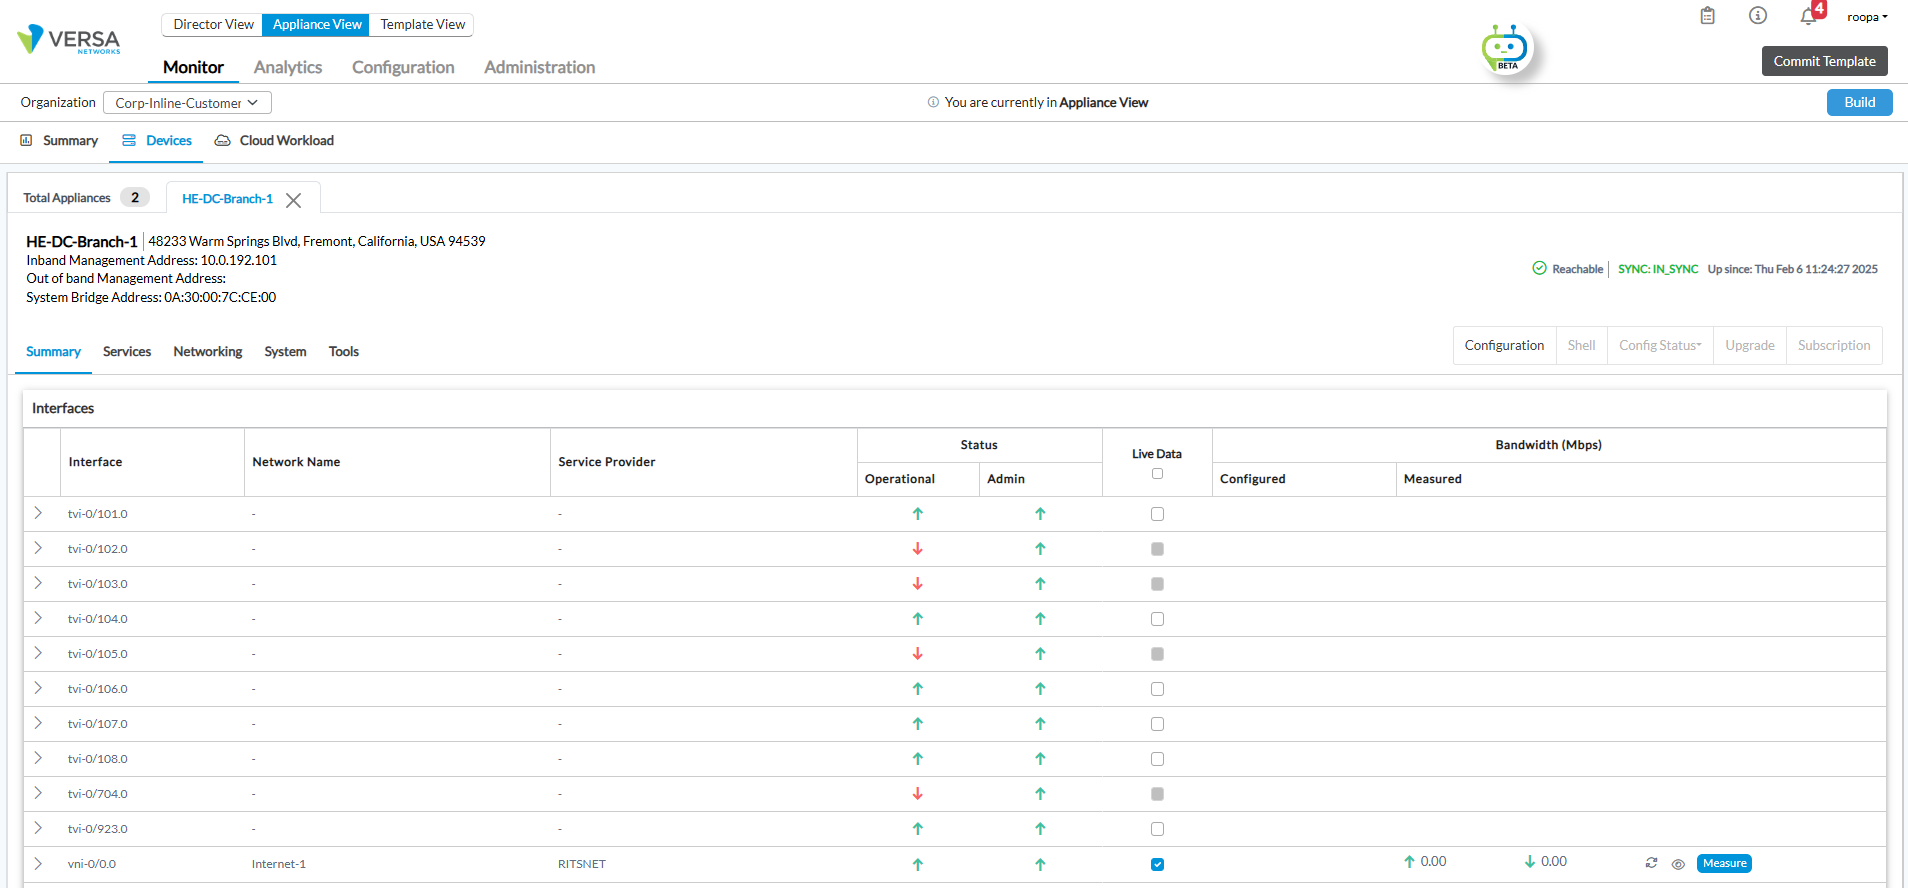
By clicking on live data box for interfaces in the above view, live usage can be viewed as follows:
Threshold Management
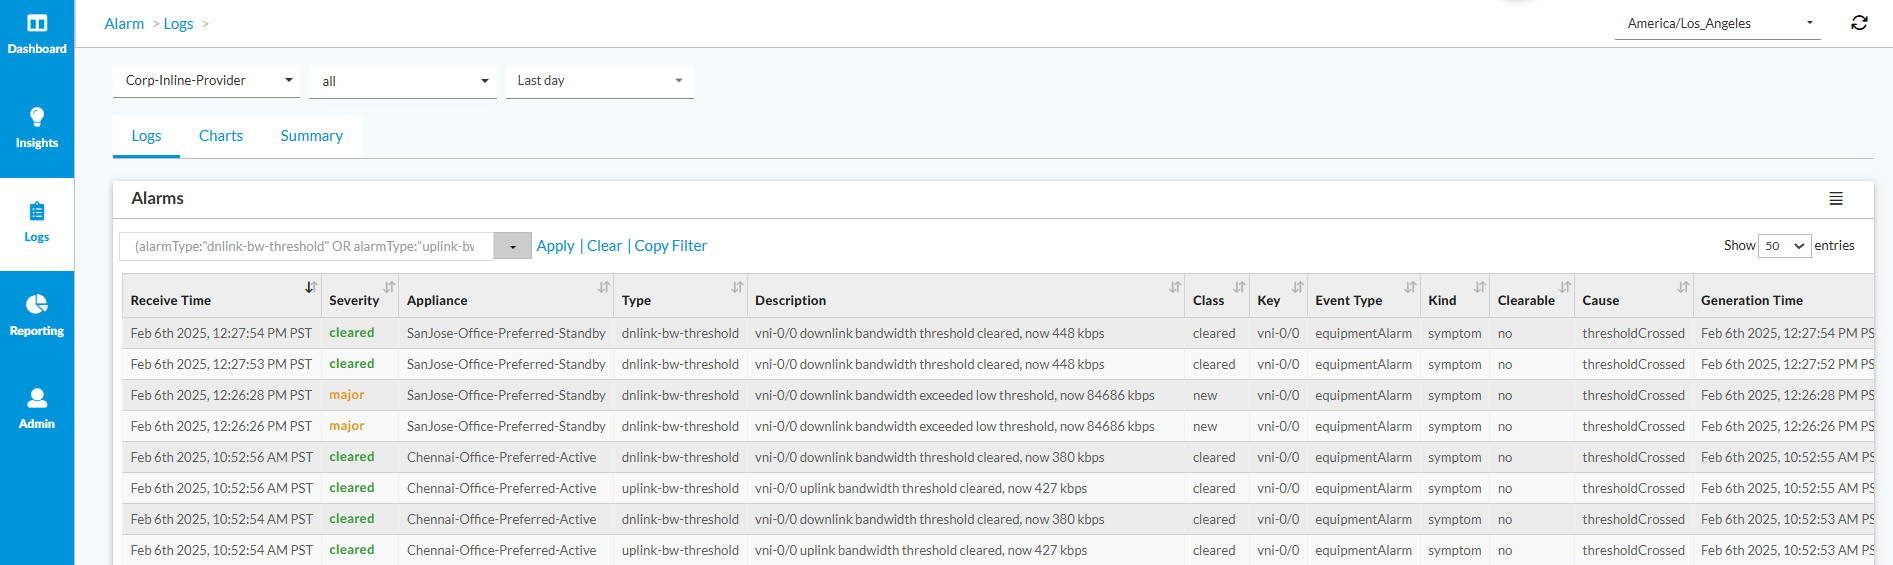
Alarms are generated when Interface uplink/downlink b/w exceeds thresholds.
- Default uplink/downlink threshold alarms:
- Low threshold: 75%
- High threshold: 95%
Users could modify the default thresholds from the director per appliance.
Uplink/downlink bandwidth threshold alarms can be seen historically in analytics under Logs> Alarm view as follows:
Additional Reading:
https://docs.versa-networks.com/Secure_SD-WAN/05_VOS_Device_Alarms/System_Alarms