Following are the primary log files we should examine while investigating system restarts/reboots/crashes.
System log(syslog): We should initiate our investigation from system logs kept under /var/log/syslog directory. These are the traditional system log files which contains general system information, including kernel messages, authentication failures, and Versa service-related events. You can use some specific keywords to filter messages such as reboot, shutdown, panic, error or failed. Beside these specific keyword search, you are encouraged to thoroughly review entire syslog generated before and after the crash or restart. Additionally, you can obtain the output of shell command “last reboot” or last to observe a list of all reboots, including timestamp. This helps you narrow down the time frame for your log search.While reviewing the syslog files you can locate when system started to boot from loaded image. You can locate keyword “Command line: BOOT_IMAGE”, this specific line provides information for huge page allocation, size of each huge page, kernal crash dump enabled/disabled and couple of other additional information.
2025-09-08 11:56:51 CPE-01 kernel:[ 0.000000] microcode: microcode updated early to revision 0x2007006, date = 2023-03-06
2025-09-08 11:56:51 CPE-01 kernel:[ 0.000000] Command line: BOOT_IMAGE=/boot/vmlinuz-5.4.0-192-generic root=UUID=da73983c-f923-42c4-80cd-b673182912e6 ro hugepagesz=1GB hugepages=16 default_hugepagesz=1GB biosdevname=0 net.ifnames=0 fsck.mode=force fsck.repair=yes audit=1 audit_backlog_limit=8192 cpuidle.off=1 processor.max_cstate=1 intel_idle.max_cstate=0 nvme_load=YES acpi_no_watchdog quiet nohz=off systemd.show_status=yes console=ttyS0,115200n8 crashkernel=512M-:192M
One crucial part to review if the system reboot/restart is triggered by watchdog. You can use following commands to verify if watchdog service is running.
[admin@MS-BLR-OFFICL-INLINE-01: ~] $ ls -l /dev/watchdog
crw------- 1 root root 10, 130 Aug 2 05:59 /dev/watchdog
[admin@MS-BLR-OFFICL-INLINE-01: ~] $ systemctl status watchdog
* watchdog.service - watchdog daemon
Loaded: loaded (/lib/systemd/system/watchdog.service; enabled; vendor preset: enabled)
Active: active (running) since Sat 2025-08-02 06:00:50 PDT; 1 months 8 days ago
Main PID: 3593 (watchdog)
Tasks: 1 (limit: 4915)
CGroup: /system.slice/watchdog.service
`-3593 /usr/sbin/watchdog
[admin@MS-BLR-OFFICL-INLINE-01: ~] $ cat /proc/sys/kernel/watchdog
1
Value of 1 indicates that watchdog is running.
Journal logs: This is the most important tool for modern Linux distributions that use systemd. It provides a centralized view of all system logs, including kernel messages, application logs, and service status. We have separate directory present for journal logs under /var/log. You can also shell command to display logs from specific period while debugging.
To check the previous boot's log: Use the command journalctl -b -1. The -b -1 flag shows the log from the boot immediately preceding the current one.
To look for a specific time: Use journalctl --since "YYYY-MM-DD HH:MM:SS" --until "YYYY-MM-DD HH:MM:SS". This allows you to pinpoint events right before the reboot occurred.
Dmesg: Dmesg log files are present under /var/log directory and archived while writing tech-support. This log file contains messages from the kernel ring buffer such as kernel related events, hardware errors and driver issues. These logs are captured during the boot process and very useful in detecting any hardware errors or issues present.
To investigate hardware errors, you can filter relevant logs with keywords such as error, failed, PCIe, ECC, Machine Check, or MCE. Below is the example of such errors.
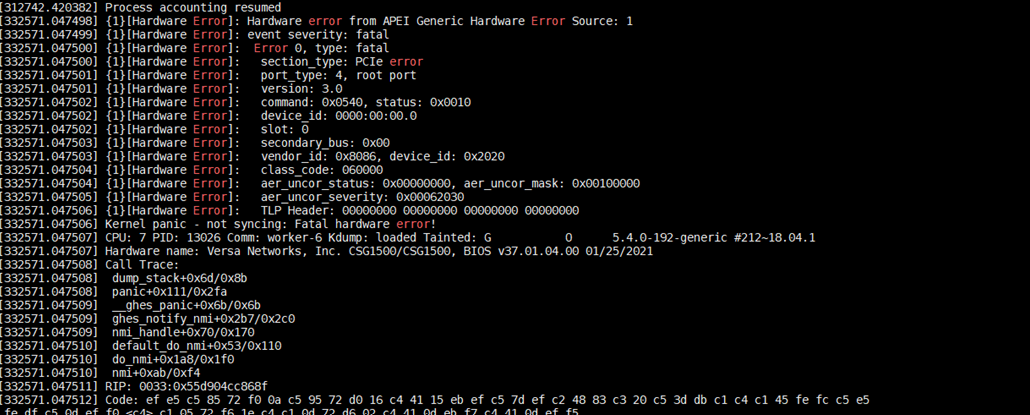
SMART SSD logs: You can locate a log file named as /var/log/versa/versa-smartctl.log which contains diagnostic information from your hard drive or SSD as part of its SMART (Self-Monitoring Analysis and Reporting Technology) system. This log file contains information for various attributes such as power cycle count, program failures, temperature details, and error counters.
Vendor Specific SMART Attributes with Thresholds:
ID# ATTRIBUTE_NAME FLAGS VALUE WORST THRESH FAIL RAW_VALUE
1 Raw_Read_Error_Rate POSR-K 100 100 000 - 0
5 Reallocated_Sector_Ct -O--CK 100 100 010 - 0
9 Power_On_Hours -O--CK 100 100 000 - 821
12 Power_Cycle_Count -O--CK 100 100 000 - 16
14 Unknown_Attribute -O--CK 100 100 000 - 313196544
15 Unknown_Attribute -O--CK 100 100 000 - 234441648
16 Unknown_Attribute -O--CK 100 100 000 - 75
17 Unknown_Attribute PO--CK 000 000 000 - 18
100 Unknown_Attribute -O--CK 100 100 000 - 210602
160 Unknown_Attribute -O--CK 100 100 000 - 0
172 Unknown_Attribute -O--CK 100 100 000 - 0
173 Unknown_Attribute -O--CK 100 100 000 - 459
174 Unknown_Attribute -O--CK 100 100 000 - 5
175 Program_Fail_Count_Chip -O--CK 086 086 000 - 442
181 Program_Fail_Cnt_Total -O--CK 100 100 000 - 0
187 Reported_Uncorrect -O--CK 100 100 000 - 0
194 Temperature_Celsius -O---K 042 053 000 - 42 (Min/Max 39/43)
195 Hardware_ECC_Recovered -O--CK 100 100 000 - 0
197 Current_Pending_Sector -O--CK 100 100 000 - 0
198 Offline_Uncorrectable ----CK 100 100 000 - 0
199 UDMA_CRC_Error_Count -O--CK 100 100 000 - 0
202 Unknown_SSD_Attribute ----CK 086 086 000 - 14
205 Thermal_Asperity_Rate -O--CK 100 100 000 - 0
231 Temperature_Celsius -O---K 054 063 000 - 925696054
234 Unknown_Attribute -O--CK 100 100 000 - 3520385920
235 Unknown_Attribute -O--CK 100 100 000 - 34280526784
241 Total_LBAs_Written -O--CK 100 100 000 - 43032259658
242 Total_LBAs_Read -O--CK 100 100 000 - 411461164
248 Unknown_Attribute ----CK 086 086 001 - 86
249 Unknown_Attribute PO--CK 000 000 000 - 18
||||||_ K auto-keep
|||||__ C event count
||||___ R error rate
|||____ S speed/performance
||_____ O updated online
|______ P prefailure warning
Understanding SMART Output
Before analyzing individual SMART attributes, it’s important to understand the columns that appear in almost every SMART report. These values help interpret whether the drive is healthy, degrading, or already failing.
Common Columns in SMART Output:
VALUE: The current normalized health score for the attribute, usually ranging from 0 to 100. In most cases, higher is better.
WORST: The lowest Value this attribute has ever recorded since the drive was manufactured. This is useful for identifying whether the attribute has degraded in the past.
THRESH:The manufacturer-defined threshold. If the value drops to or below THRESH, the drive considers this attribute to be in a pre-failure state.
FAIL: If this shows anything other than a dash (-), it means the drive has already crossed the failure threshold for that attribute.
RAW_VALUE: The actual real-world measurement or counter. This is typically the most meaningful value for troubleshooting, since it reflects the true number of errors/events rather than a normalized score.
The following attributes are direct indicators of hardware health issues. Any non-zero value or upward trend should be treated seriously until proven stable.
Reallocated_Sector_Ct (ID 5) : This measures how many bad sectors the drive has detected and remapped to spare sectors. 0 is normal Any value above 0 indicates the drive has already encountered physical media damage. A small count may remain stable, but if this number increases over time, it strongly suggests the drive is deteriorating and should be considered for replacement.
Reported_Uncorrect (ID 187) : This counts errors the drive could not correct, even after internal recovery attempts. Any non-zero value is a major red flag. These errors represent real data integrity risk.Even a value of 1 should be escalated and investigated.
Current_Pending_Sector (ID 197) : This tracks unstable sectors that the drive has marked for potential remapping. A non-zero value means the drive has sectors that are failing but not yet fully remapped. If this count increases across successive log captures, treat the drive as actively failing.
Offline_Uncorrectable (ID 198) : This counts sectors that failed verification during offline scanning and could not be corrected. Any non-zero value is a warning sign. If combined with Current_Pending_Sector, it strongly indicates physical media degradation.
Program_Fail_Count_Chip (ID 175) / Program_Fail_Cnt_Total (ID 181): These are SSD/NVMe-specific attributes that track failed program/write operations to NAND flash. A value of 0 is expected. A non-zero and rising value indicates NAND flash wear or instability. For example, if ID 175 shows a RAW_VALUE of 442, it should be flagged and tracked over time to confirm whether it is stable or increasing.
UDMA_CRC_Error_Count (ID 199) This counts errors during data transfer between the drive and the host controller. These errors usually point to an interface issue (cable, connector, backplane, controller). They do not always mean the drive itself is failing. A non-zero value should trigger checks of physical connections and hardware components.
Secondary Attributes
These attributes do not necessarily indicate failure by themselves, but they provide valuable context when troubleshooting crashes or performance issues.
Power_On_Hours (ID 9): Total number of hours the drive has been powered on.
Power_Cycle_Count (ID 12): Counts how many times the drive has been powered on/off. A high number relative to Power_On_Hours may indicate frequent reboots. Useful for identifying power instability or unexpected shutdown patterns.
Temperature_Celsius (ID 194 / ID 231): Shows current and historical drive temperature data. Most SSDs operate safely within 0–70°C. If max temperatures consistently exceed 60°C, investigate airflow and cooling.
Sustained high temperature accelerates flash wear and increases failure probability.
Hardware Issues:
Look for logs containing phrases like:
Kernel panic - not syncing: This is a critical signal that the kernel had to stop due to an unrecoverable error. .
Machine Check Exception or MCE: This means the CPU itself detected a hardware fault, often related to memory, a bus, or an internal processor component.
Hardware Error or PCIe Bus Error: These are direct indicators of problems with a physical device or a component like a graphics card or network adapter.
Out of Memory (OOM): While this can sometimes be a software issue, if it's accompanied by system freezes or crashes, it can indicate a problem with the system's RAM.
Software Issues:
Look for messages that point to a process or driver failure, such as:
segmentation fault: A specific program tried to access a restricted memory location.
BUG: unable to handle kernel paging request: This is a type of kernel panic caused by a software bug, where a kernel process tries to access an invalid memory address.
Unusual application or service errors that repeatedly appear right before the reboot.
Killed process: The Linux Out-of-Memory Killer terminated a process to free up memory, which could lead to instability or a crash