What is IP SLA Monitor?
IP SLA monitor is a generic monitoring framework developed for use with monitoring either a single or list of IP/FQDN destinations. Once defined and attached, the monitor will probe the liveness of the individual destinations specified by continuously sending probes and flagging the monitor object up or down accordingly. A monitor object can be attached to a static route or policy option. Once attached the status of the monitor will be notified to modules handling static route and policy option to take action accordingly. A single monitor object can be attached to multiple static routes and policy options simultaneously.
Configurations:
Follow these steps to configure and view the IP SLA:
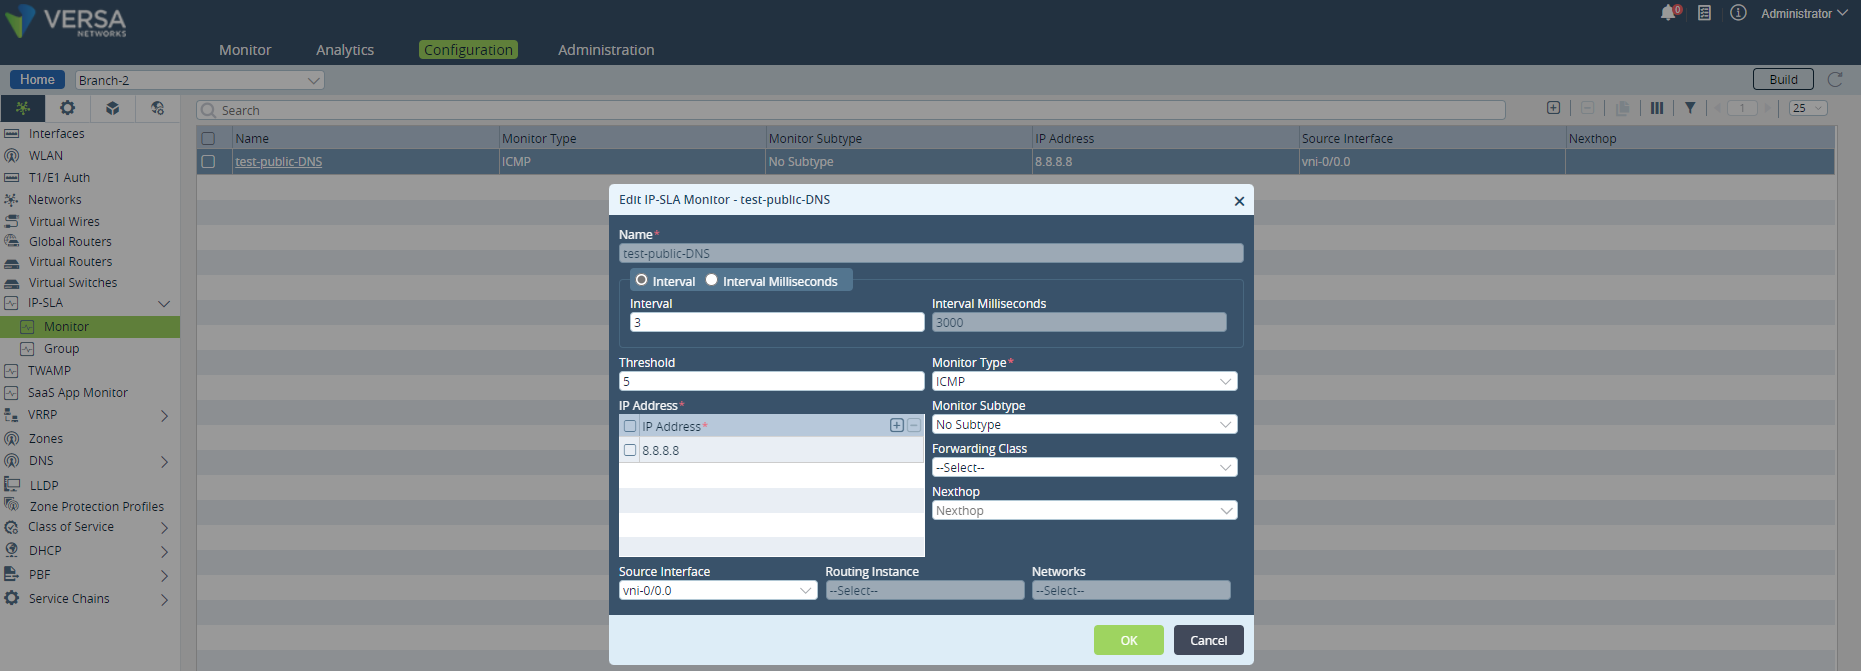
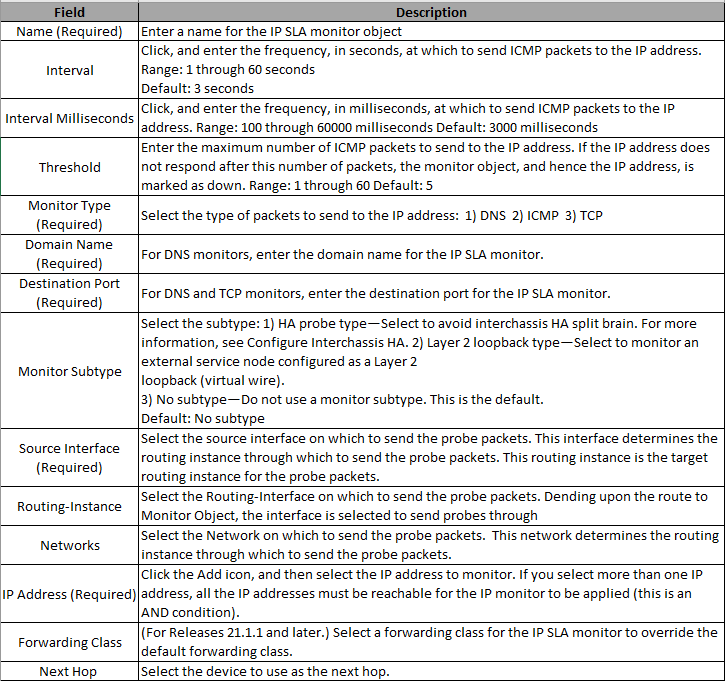
NOTE: In the example above, the source-interface for monitor object test-public-DNS is configured to vni-0/0.0. Run the show interfaces brief CLI command to check the routing instance to which this interface belongs.

Since this interface belongs to routing-instance mpls-Transport-VR, the corresponding monitor object inherits this routing-instance and start sending the probe packets in mpls-Transport-VR.
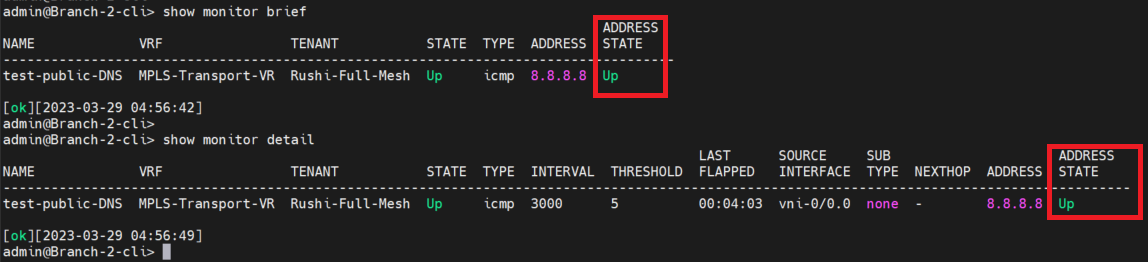
Run the show monitor brief and show monitor detail CLI command to view the IP SLA monitoring information.
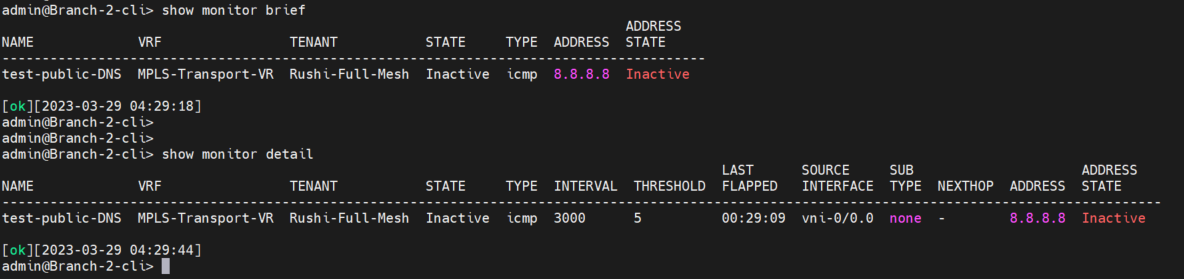
where,
Field | Description |
Name | The name of the monitor object. |
Address | The IP address that the monitor is currently monitoring. |
VRF | The routing-instance this monitor uses to check for the reachability of the configured address. |
Tenant | Tenant to which this monitor belongs. The tenant information is derived from the routing instance. |
State | The current state of the monitor. These are the values:
|
Type | The type of probe packet (DNS, ICMP or TCP) |
Interval | This value determines the frequency (in seconds) at which the probe packets are sent. The value range from 3 - 60 sec. The default value is set to 3 sec. |
Threshold | This scalar value determines the loss of probe packets or non-receipt of probe reply, before declaring the monitor as down. The value ranges from 1 - 60. The default value is set to 5. |
Last Flapped | This displays the last time when the monitor changed its status. |
Applying the Monitor Config to a Static Route
- Run the set routing-instances <routing-instance> routing-options <static> route <ip-address> monitor <monitor-name> CLI command to apply monitoring configuration to a static route.
Example:
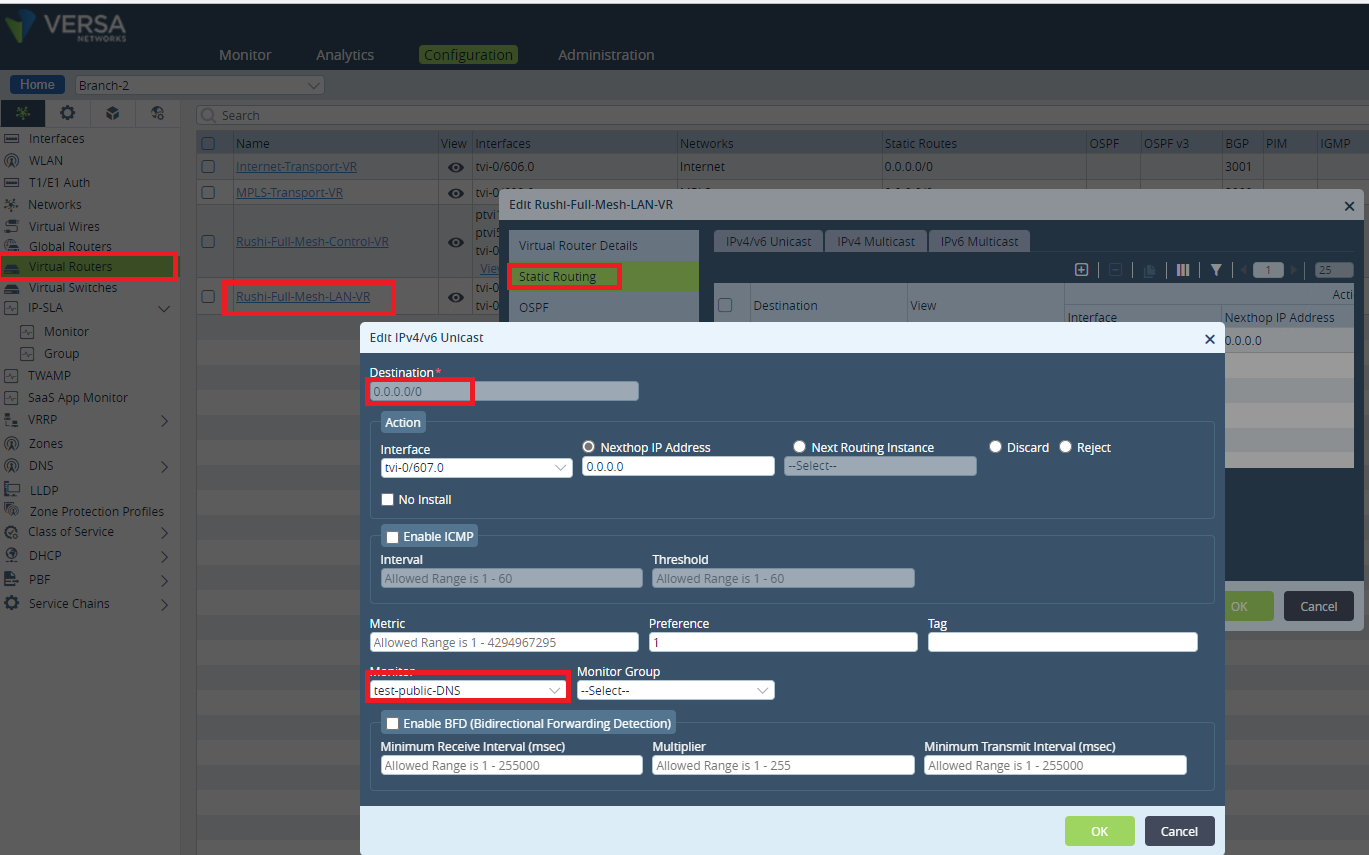
Run the show routing-instances <routing-instance> routing-options <static> route CLI command to view the static route monitoring configuration details.
Example:

Run the run show monitor detail CLI details to check the status of the monitor. An Up state indicates the route addition.
Example:
Applying the Monitor Config to a Redistribution Policy
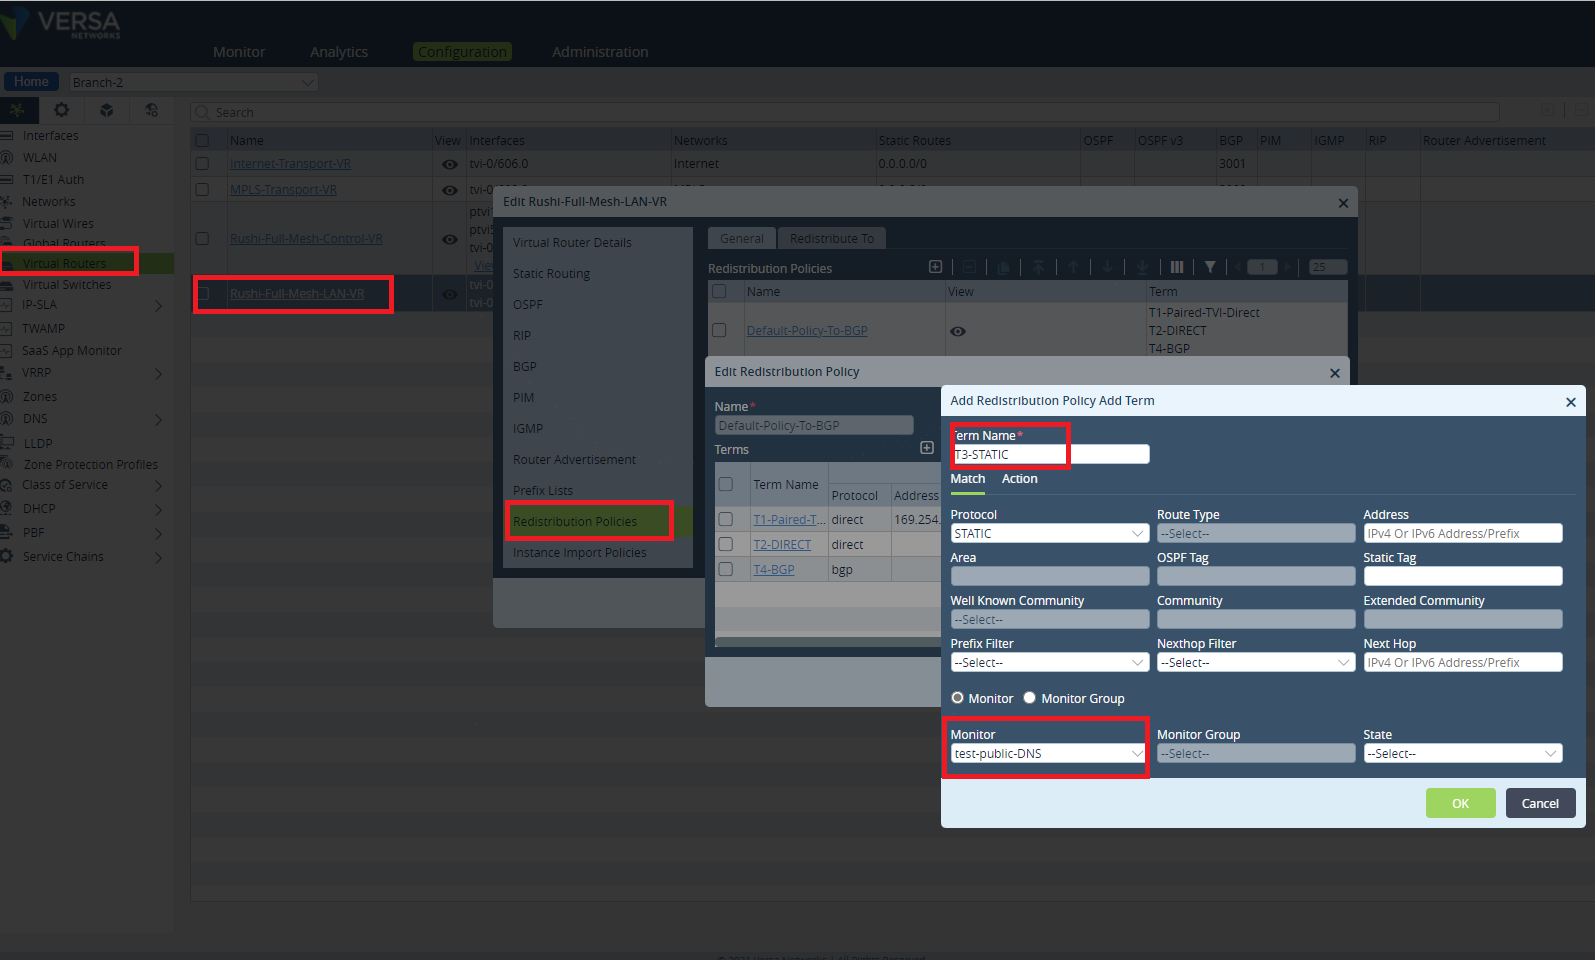
You can apply the monitor objects under routing instance policy-options as one of the match conditions. In addition to the other match conditions, the monitor state is also considered for the match condition.
Follow the steps in this example to configure the routing instance policy-options:
- Run the set routing-instances <routing-instance> policy-options redistribution-policy <policy-name> term <term-name> match monitor <monitor-name> CLI command to apply monitor configuration to a redistribution policy.
Example:
Troubleshooting:
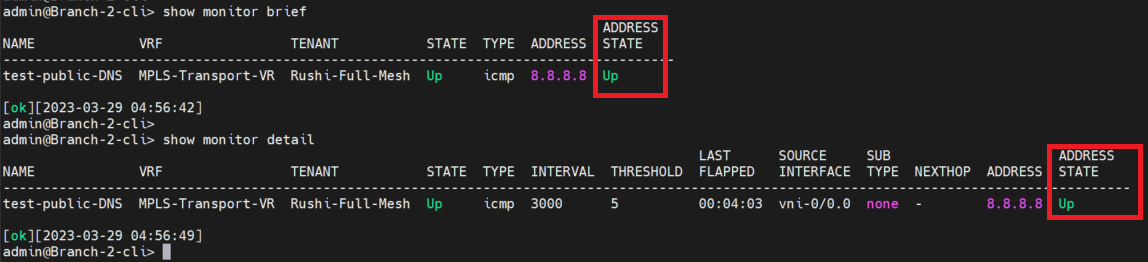
- Check the IPSLA monitor status.
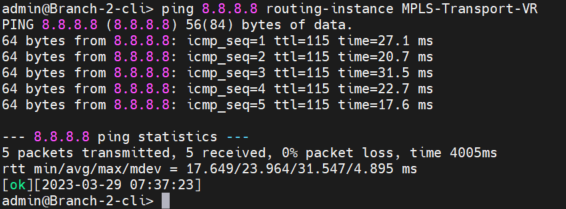
- If the IPSLA is down check the connectivity from the respective routing instance to the destination.
- If the IPSLA is down, make sure the IPSLA is used somewhere. Like in Static routes, Redistribution policy etc..

- Check the Alarms “show alarms”.

- Check the services. The Interface IP Address might not be configured. Could not get the local Address.

- Run tcpdump on the respective interface and check ICMP probes are getting a reply or not.
